Andes Capital — Real Estate Sales Analysis
Revenue, Property, Channel and Customer Cohort Analysis
Analyzed real estate sales across 2023–2024 through executive KPIs, property and channel performance, geographic and monthly patterns, and customer cohort views in Tableau.
Business objective
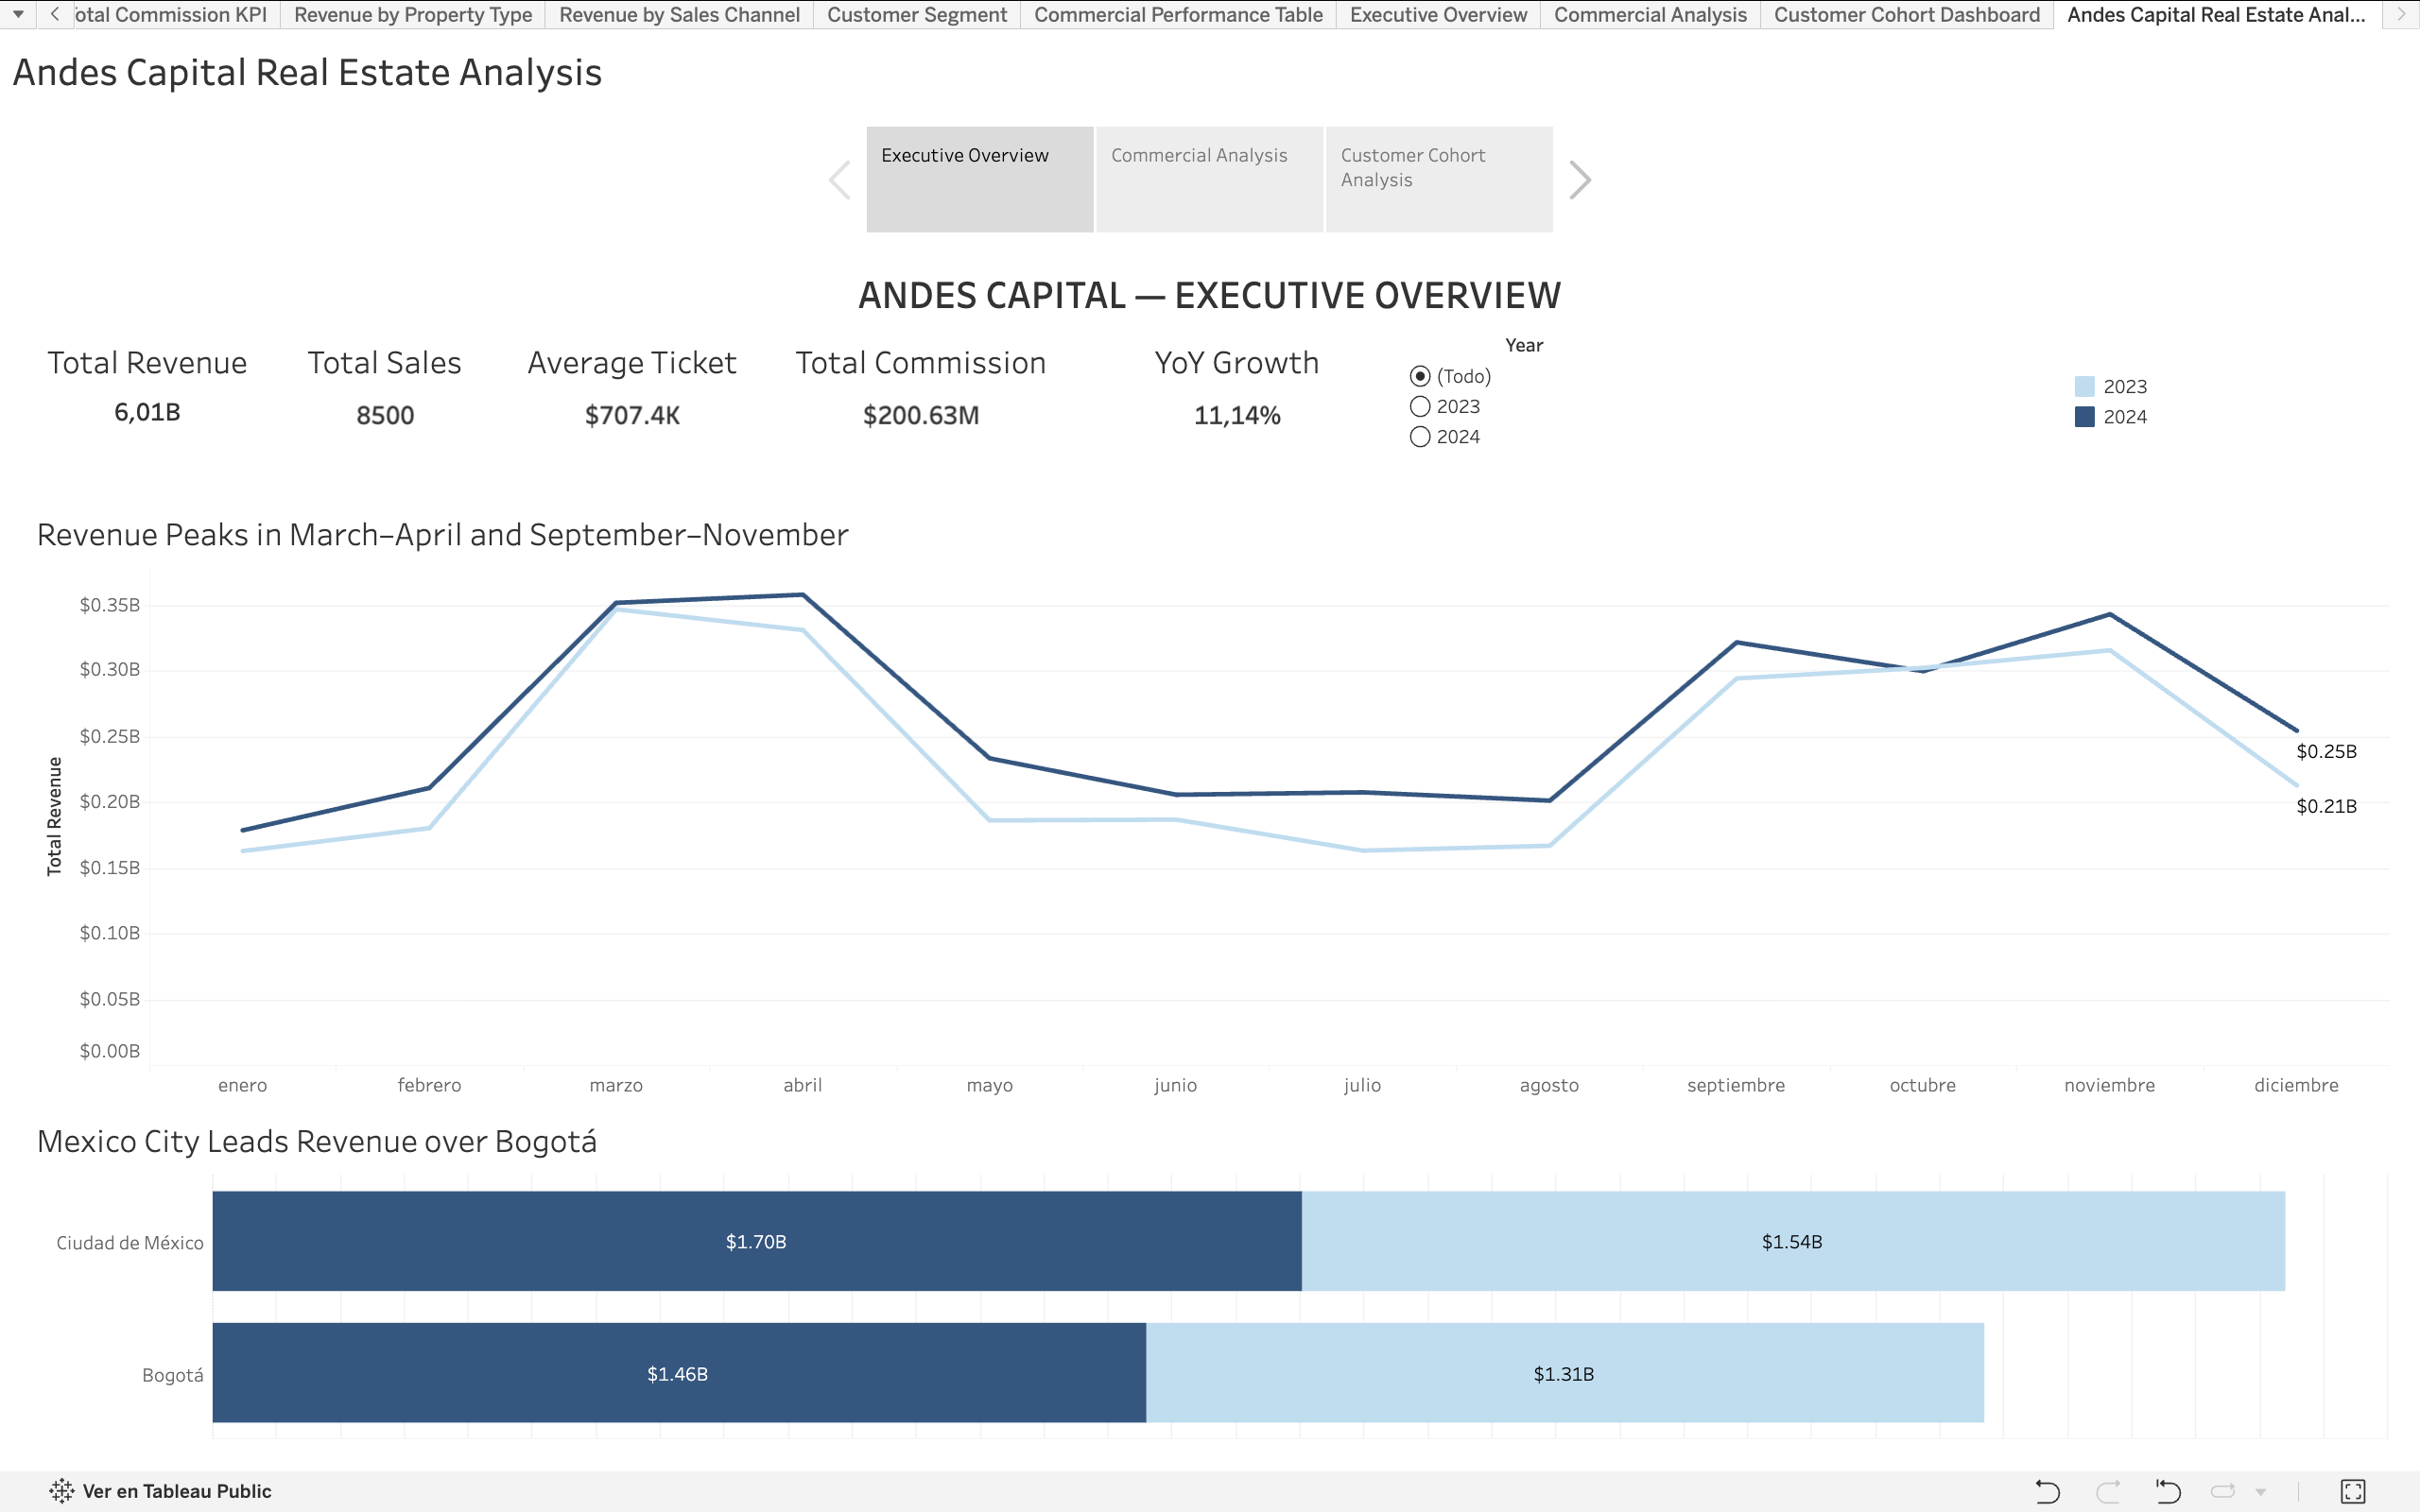
Evaluate commercial performance and identify the sales, channel, customer, property and time patterns associated with the results. The project presents three complementary views: Executive Overview, Commercial Analysis and Customer Cohort Analysis.
Executive overview
Commercial performance
| Dimension | Observed result |
|---|---|
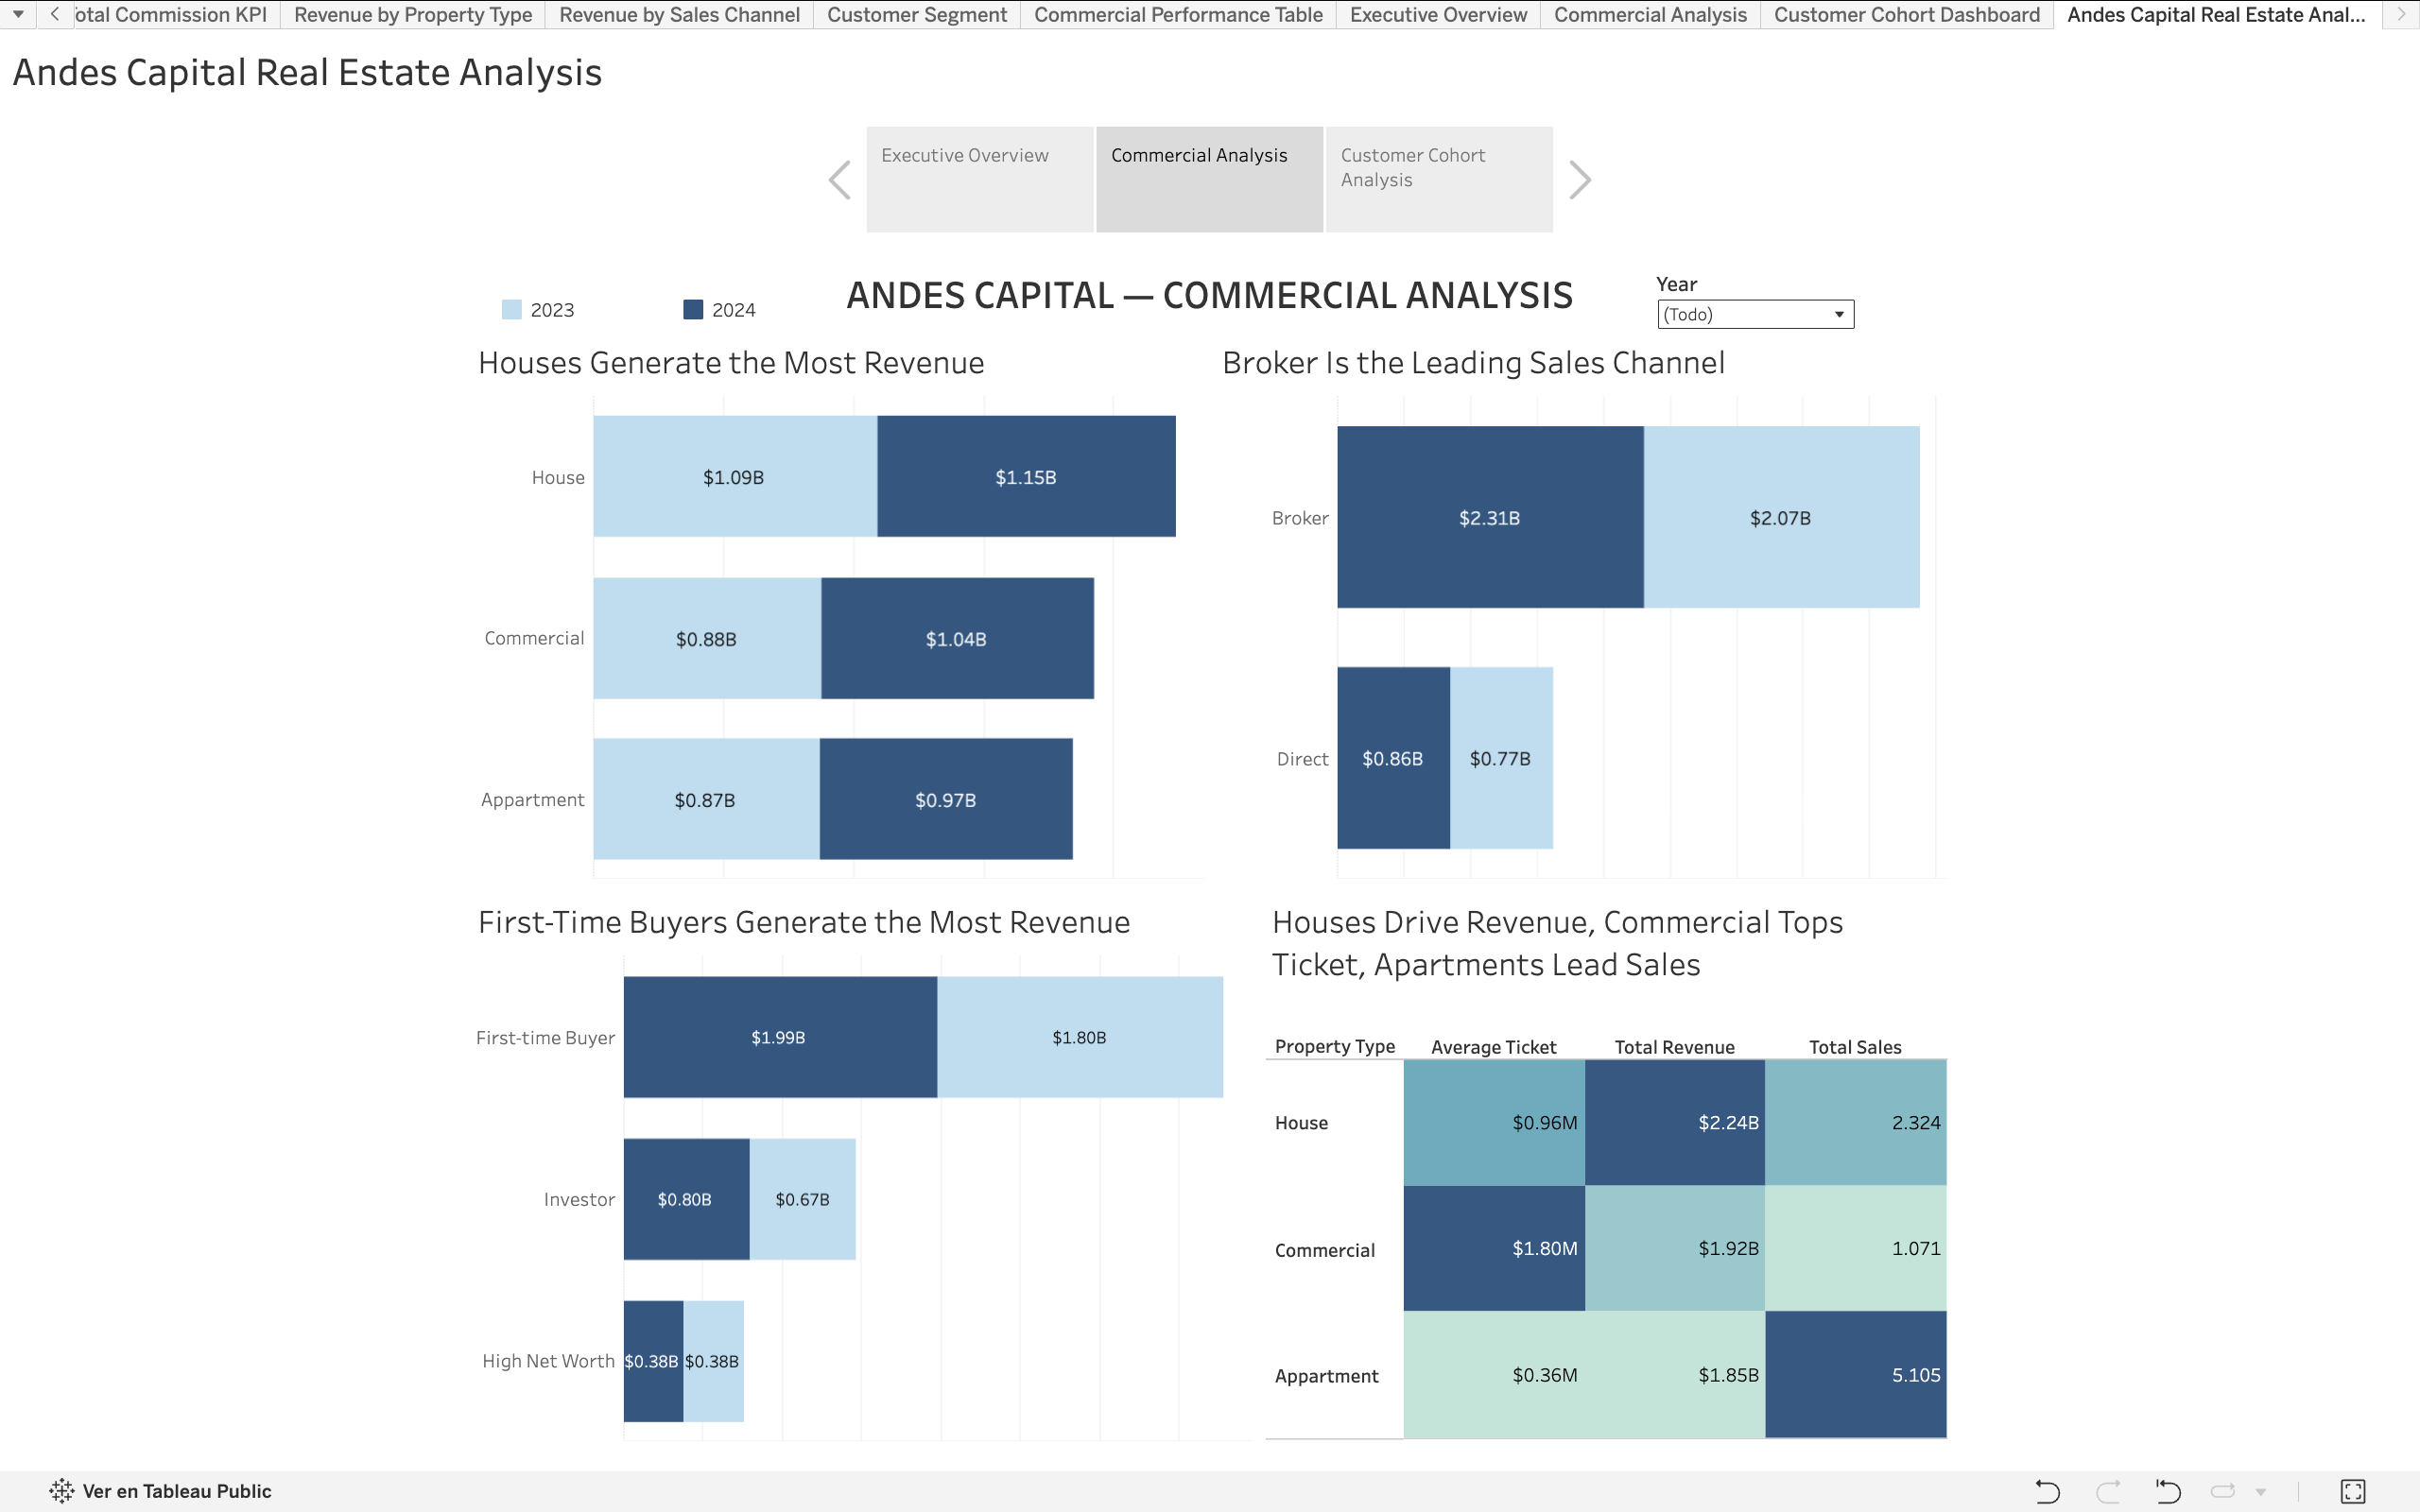
| Property types | Houses led total revenue; Commercial properties led average ticket; Apartments led sales volume. |
| Sales channel | Broker channel generated approximately 73% of total revenue. |
| Customer segment | First-Time Buyers accounted for approximately 63% of revenue. |
| Geography | Mexico City generated more revenue than Bogotá. |
| Time pattern | Revenue peaks appeared around March–April and September–November. |
Customer cohort analysis
Recommendations based on the findings
- Monitor Broker channel performance and compare its revenue trend with Direct sales, given the high share of revenue from brokers.
- Distinguish revenue, average ticket and sales volume when setting priorities by property type.
- Monitor First-Time Buyers alongside repeat buyers when reviewing the sales mix.
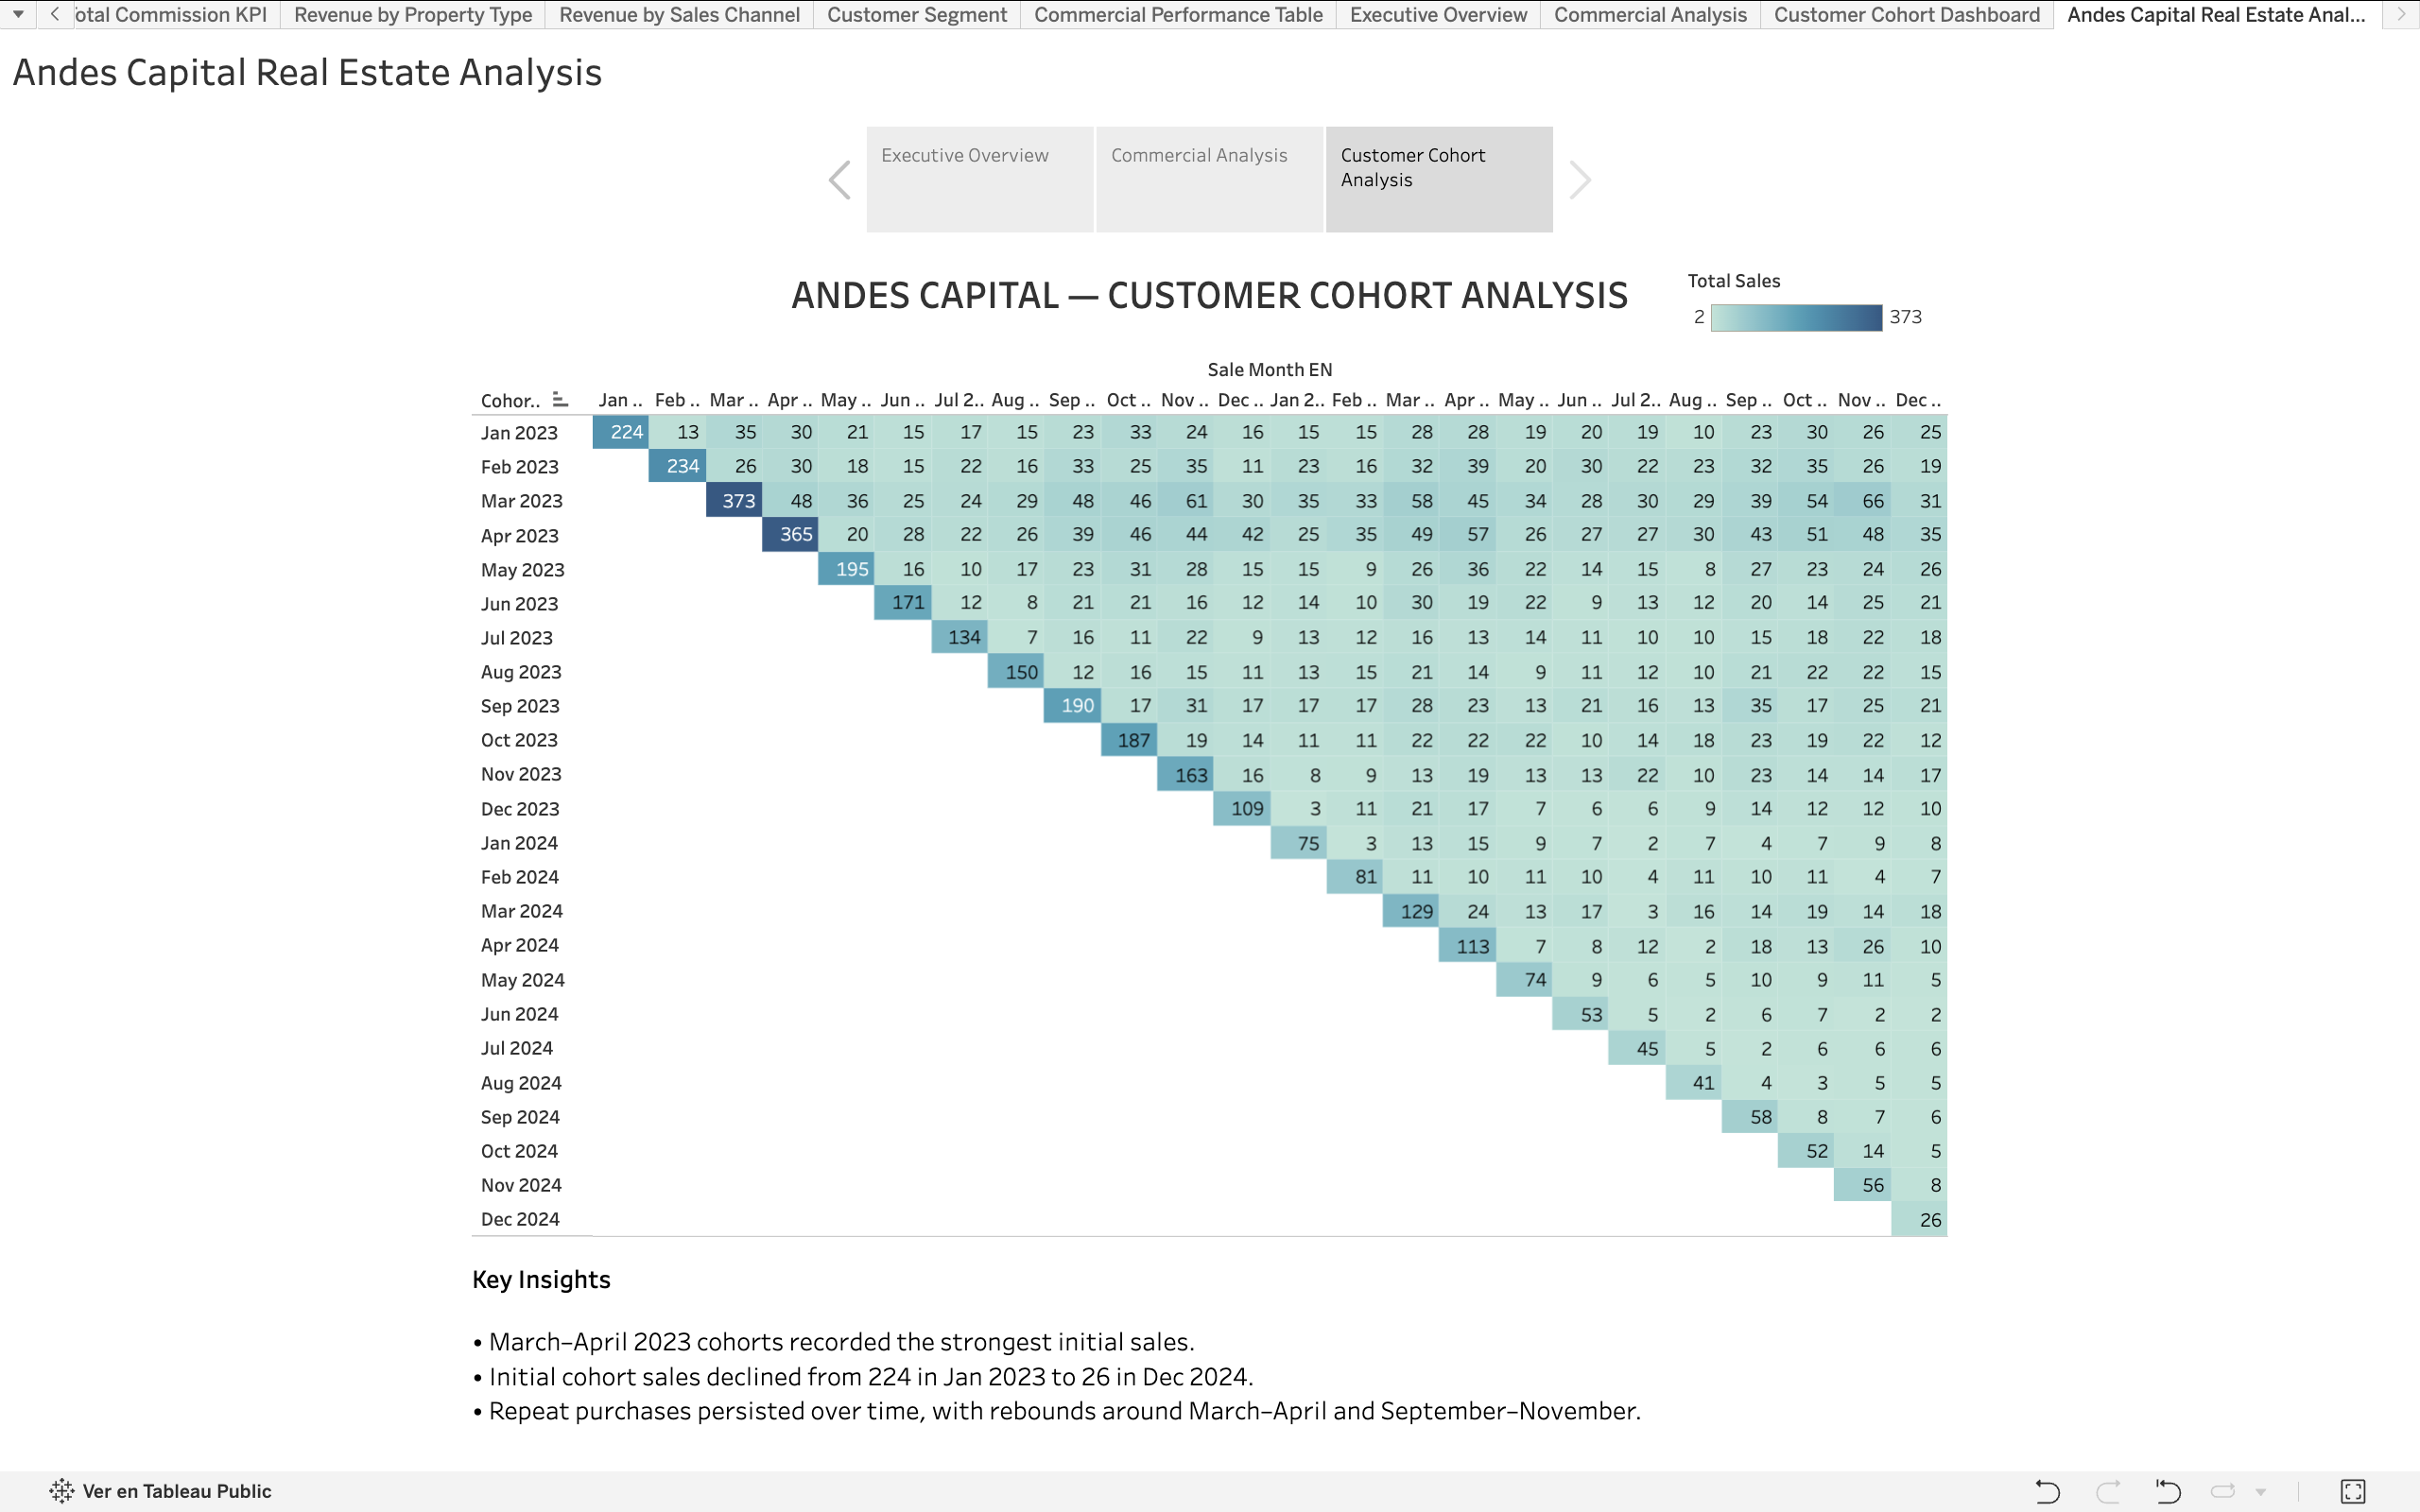
- Compare initial cohort sales separately from repeat purchases; lower initial counts alone do not demonstrate lower retention.
- Use recurring monthly peaks as a reference for planning, while checking whether the pattern continues.
Tools and methods
Tableau Public · KPI analysis · LOD expressions · Cohort analysis · Dashboard design · Data visualization · Data storytelling.
Revenue share and average ticket do not establish profitability. Cohort sales counts do not by themselves measure retention. The monthly patterns describe the two years analyzed and should not be treated as guaranteed future demand. Recommendations are proposed actions; their business impact was not measured. The raw course dataset is not included in the repository.