Andes Retail — Commercial Performance Analysis
Commercial Performance Across 2024–2025
Compared Andes Retail Group's 2024 and 2025 performance across revenue, margin, orders, customer segments, product categories, geography and seasonality using Tableau dashboards.
Business objective
Understand how commercial performance changed between 2024 and 2025 and identify the product, customer, geographic and seasonal patterns associated with those changes. The work is presented through an executive overview and a detailed dashboard.
| Metric | 2024 | 2025 | Change |
|---|---|---|---|
| Revenue | 2,863,384 | 2,668,610 | −6.8% |
| Margin | 1,005,811.62 | 935,937.71 | −6.9% |
| Orders | 2,550 | 2,450 | −3.9% |
| Average Order Value | 1,122.90 | 1,089.23 | Decreased |
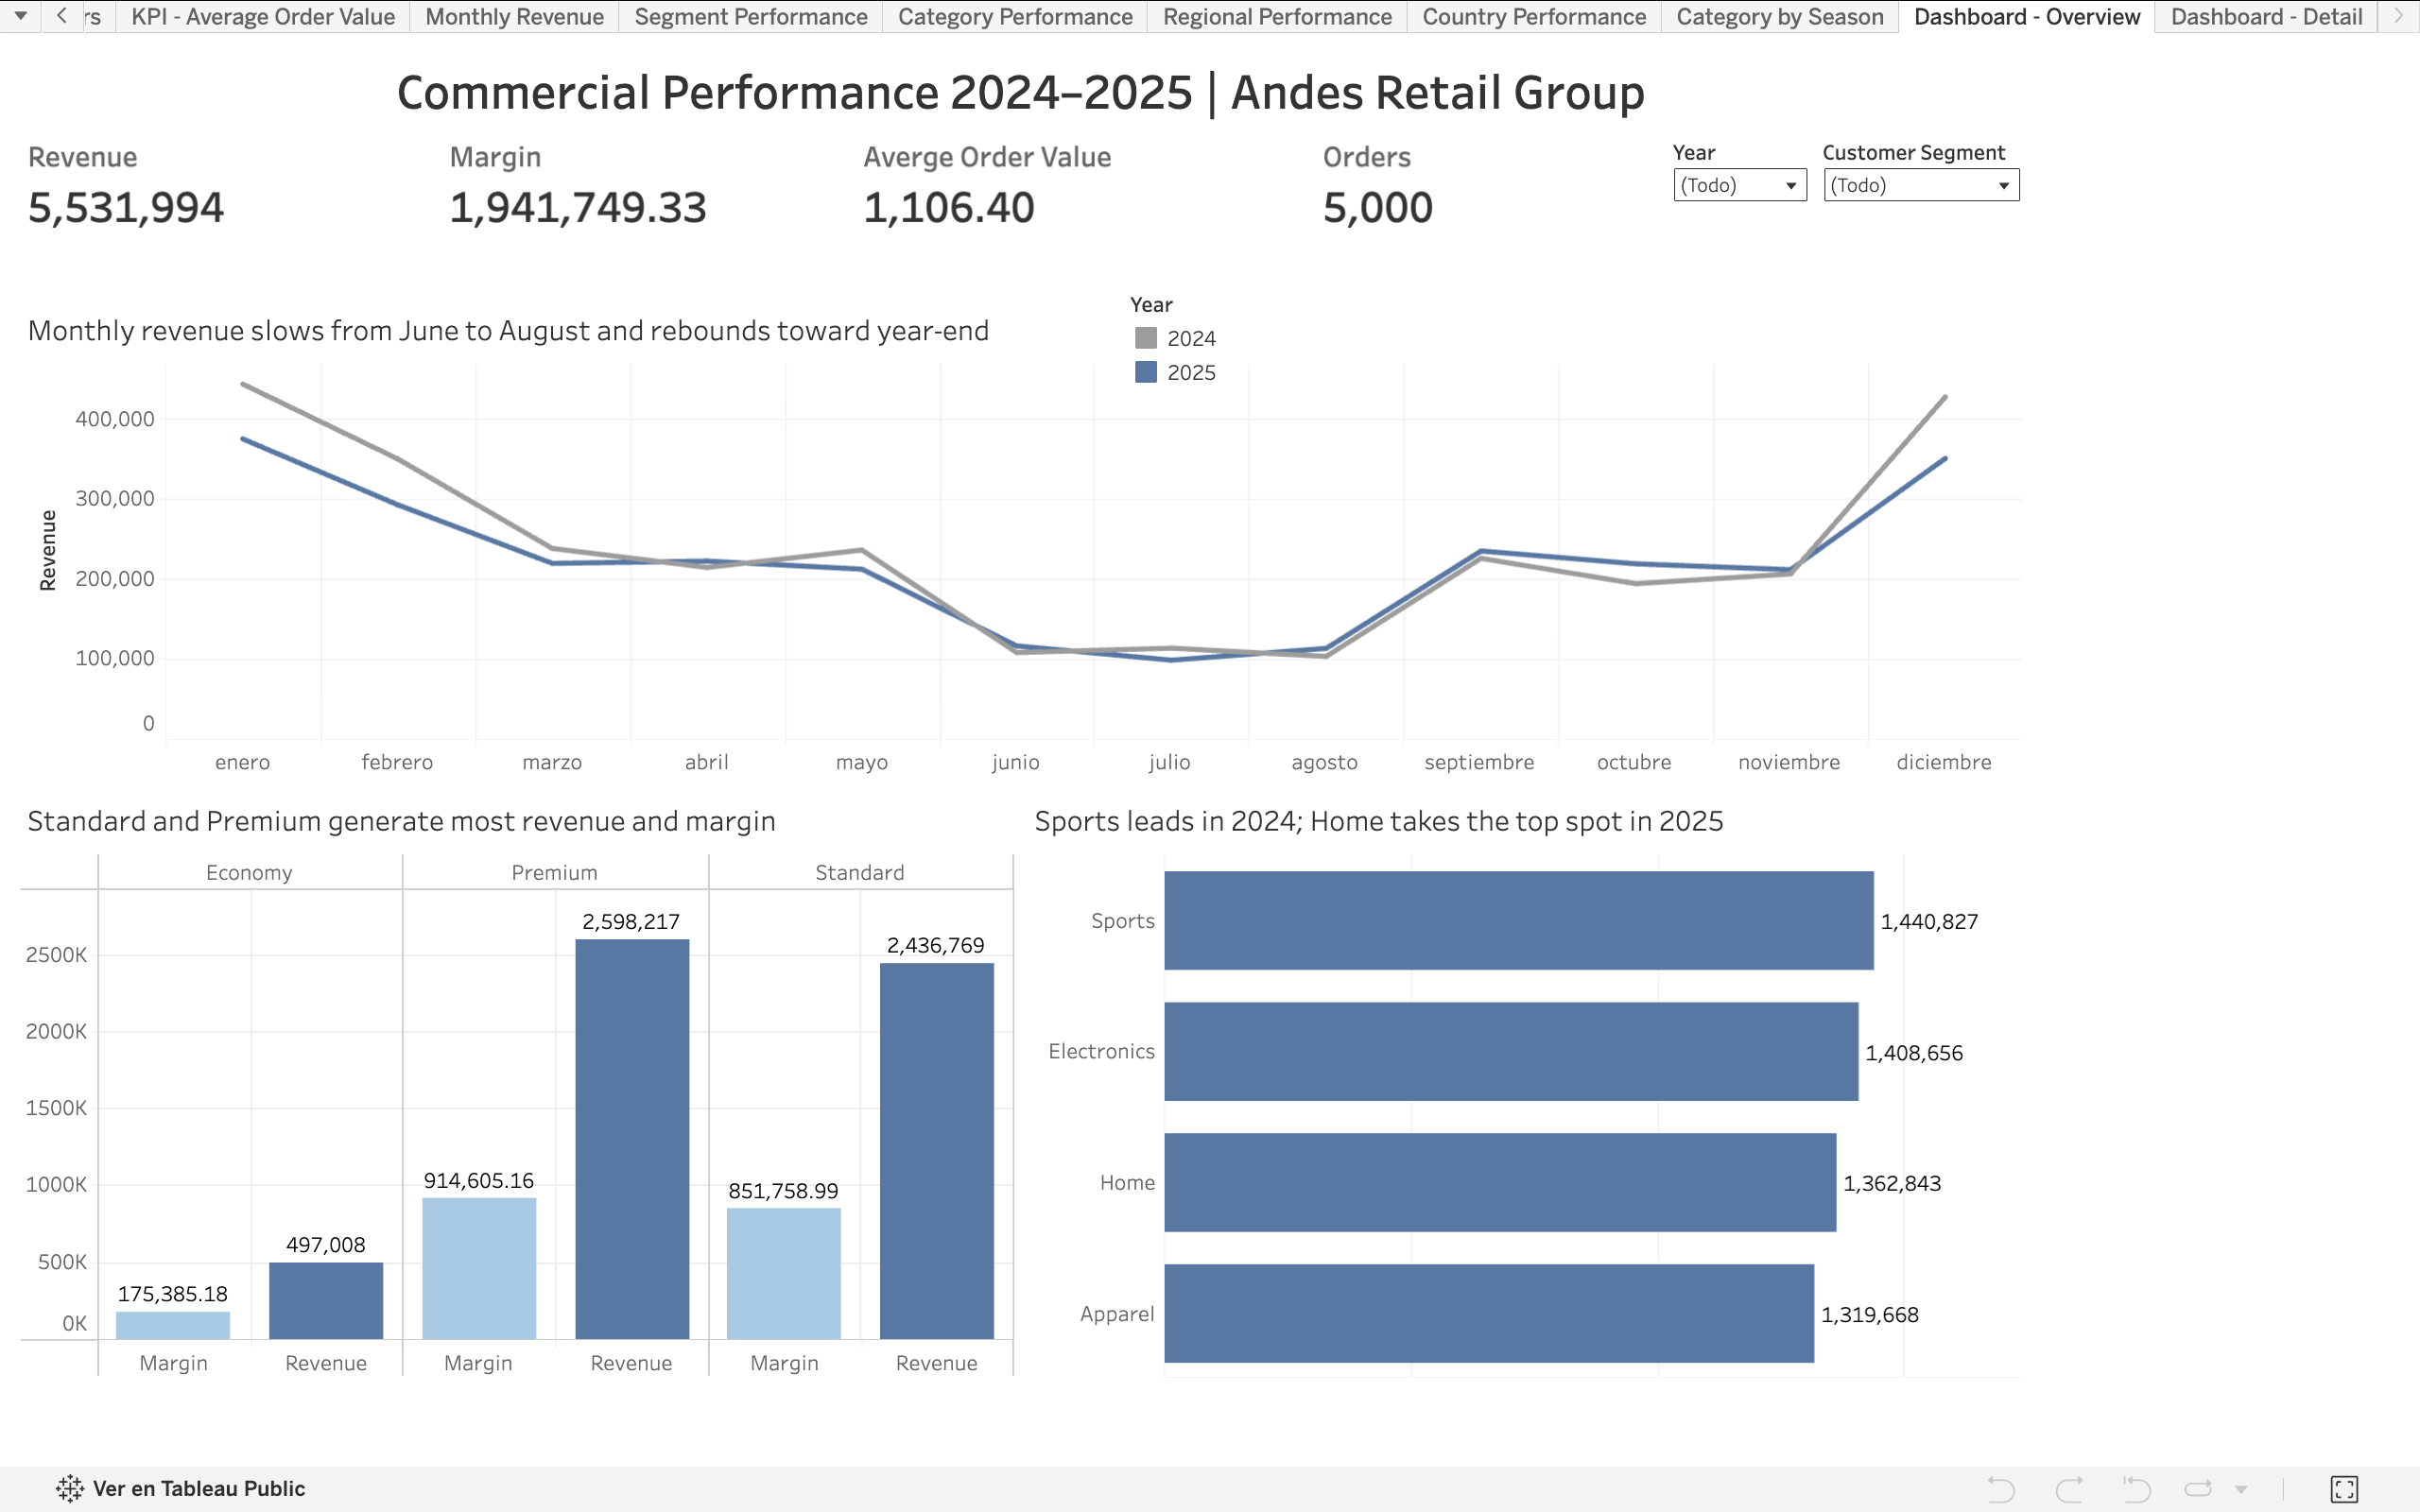
Across both years, the dataset records 5.53M in revenue, 1.94M in margin and 5,000 orders.
Dashboard — Overview
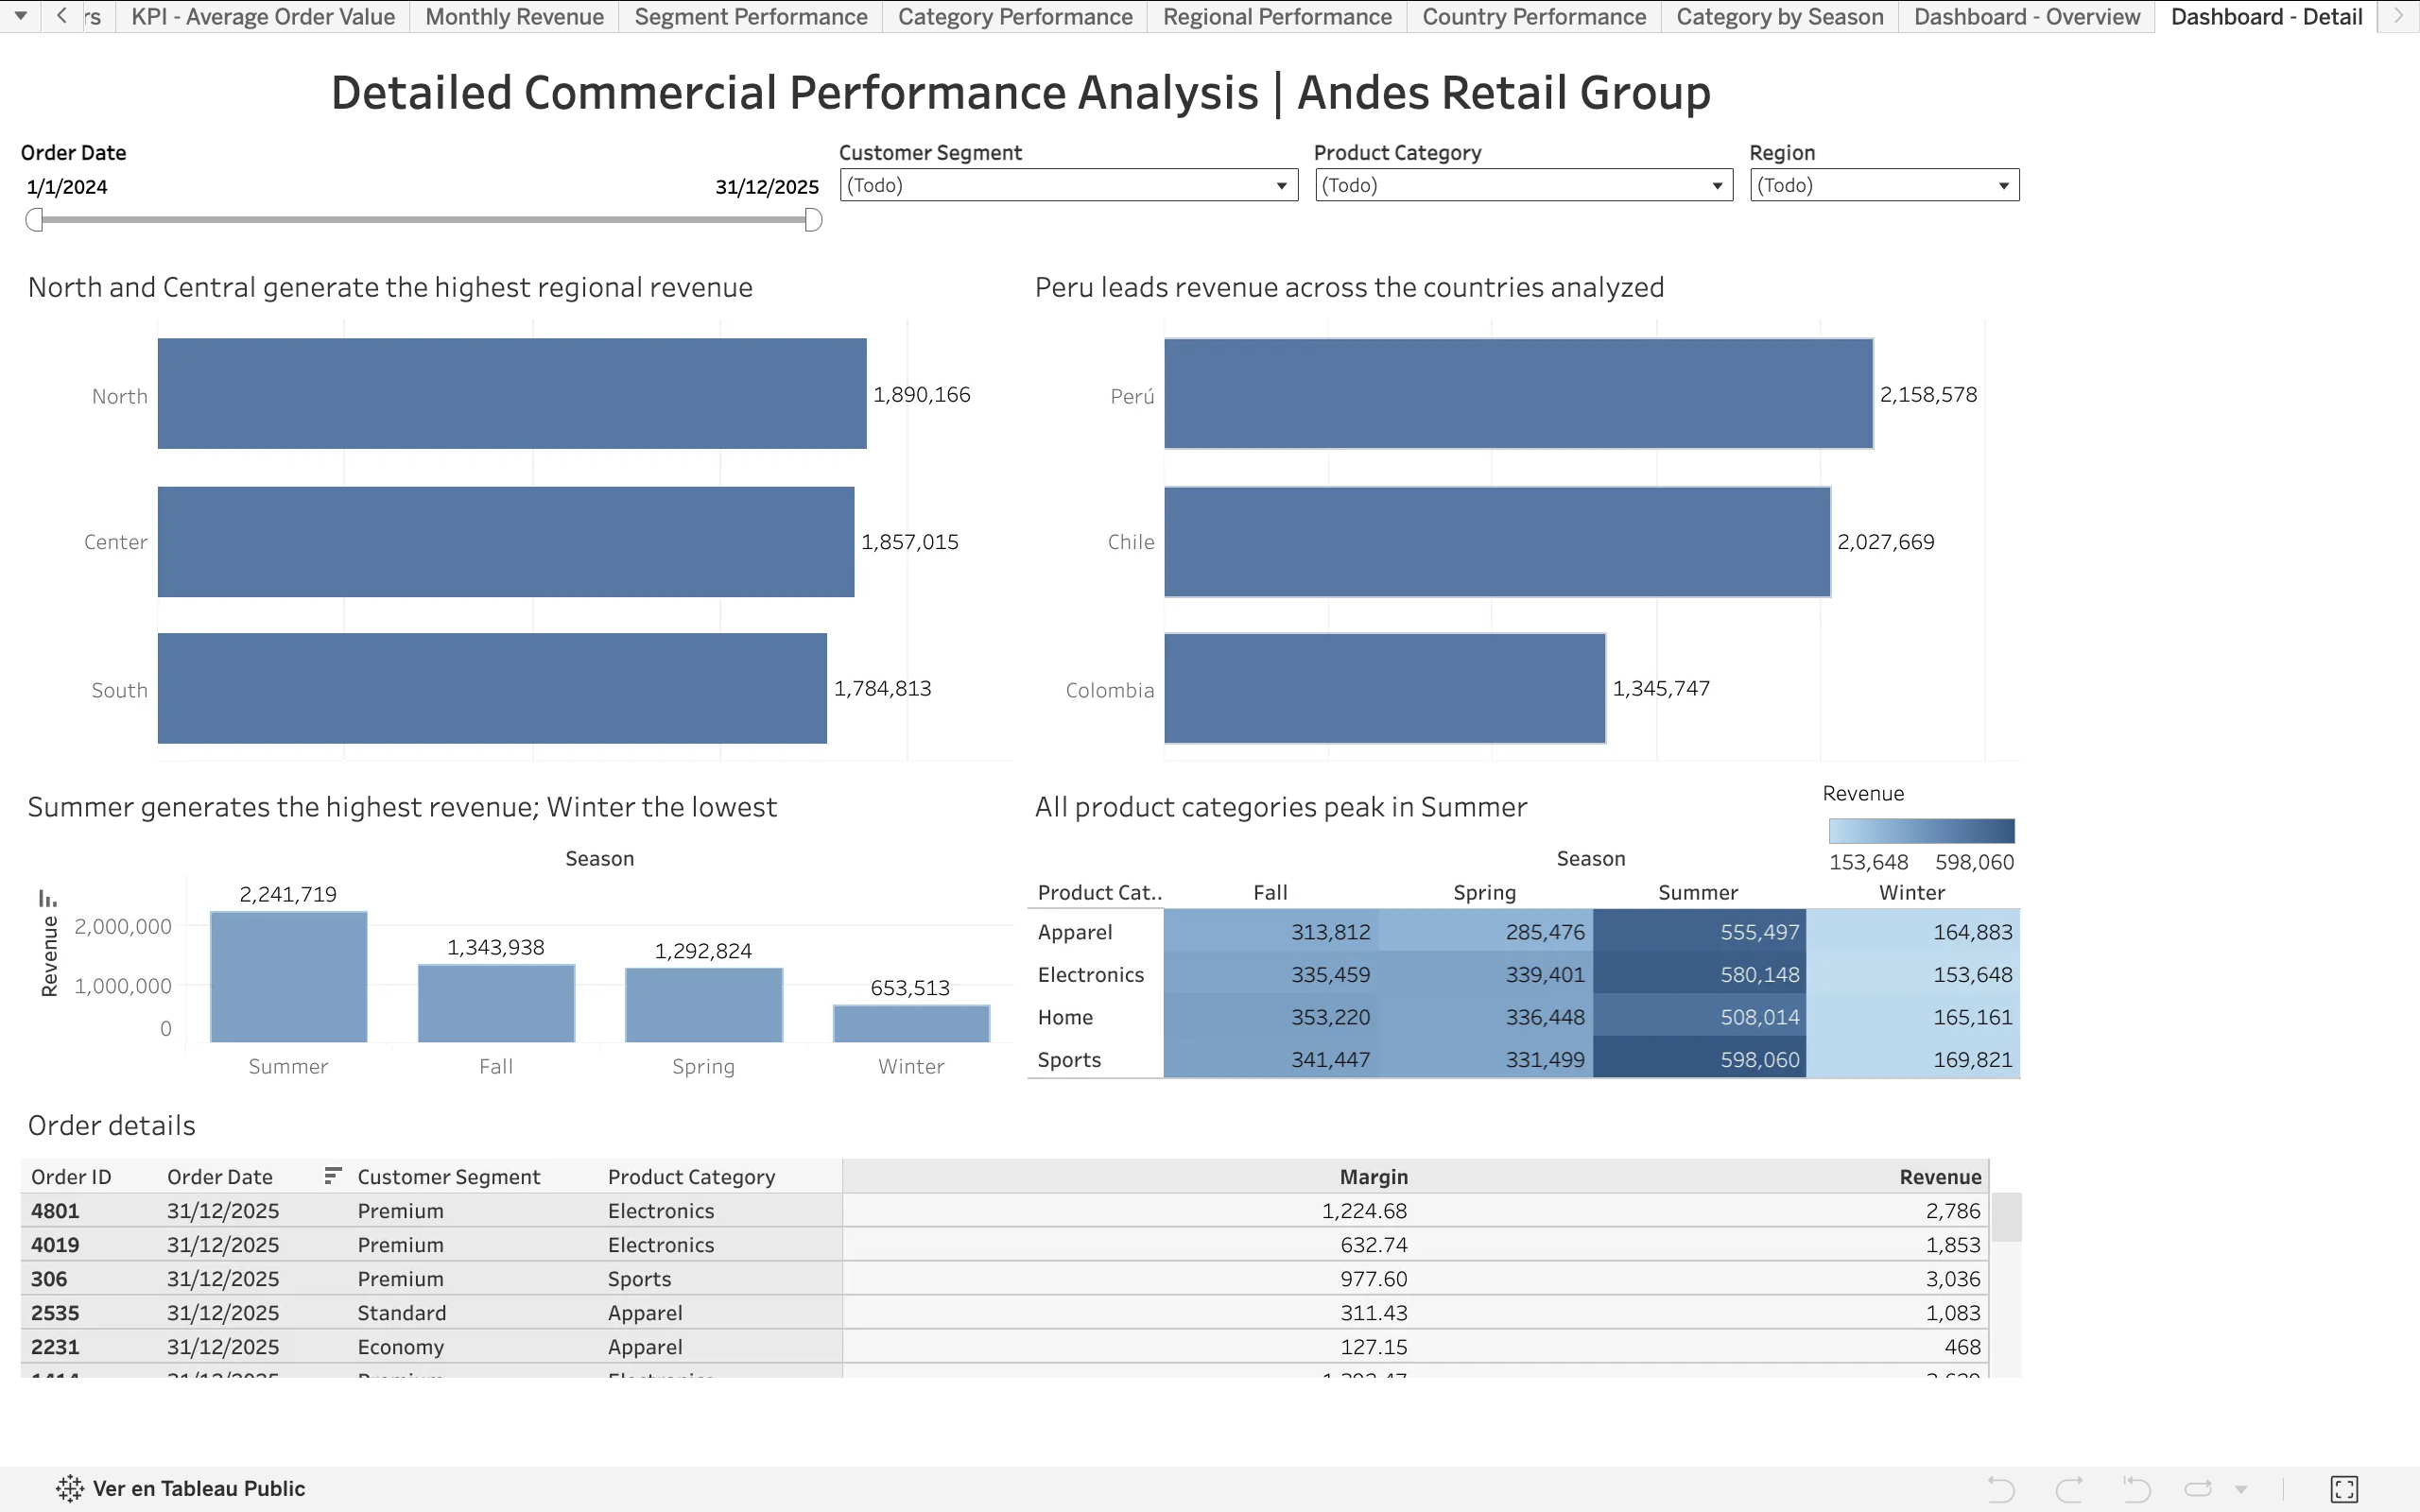
Dashboard — Detail
Key findings
- Revenue declined by approximately 6.8% in 2025, accompanied by lower margin, order volume and average order value.
- Home moved from the lowest-revenue category in 2024 to the highest-revenue category in 2025.
- The Economy customer segment consistently generated the lowest revenue and margin amounts.
- Peru generated the highest revenue among the countries analyzed.
- Summer generated more than three times the revenue of Winter; all product categories reached their highest revenue during Summer.
- Monthly performance was weaker between June and August, followed by a rebound toward year-end.
Recommendations based on the findings
- Review orders and average order value by category and customer segment to identify where the decline is concentrated.
- Compare Home's results with other categories before changing commercial priorities; a higher ranking alone does not prove growth.
- Review Economy's order volume and average order value before deciding how much commercial attention it needs.
- Investigate lower-activity months and use the year-end rebound as a reference for planning.
- Monitor Peru alongside other countries when reviewing geographic sales priorities.
Tools and methods
Tableau Public · Business Analysis · Data visualization · KPI analysis · Dashboard design · SCQA business communication.
Margin is a monetary amount, not a percentage or net profit. Lower segment totals do not by themselves establish lower customer value. Monthly results and the dataset's Season labels are separate views; Summer is not assumed to mean June–August. The observed patterns do not establish the causes of the decline. Recommendations are proposed next steps; their business impact was not measured.