MercadoLibre — Funnel & Retention Analysis
E-commerce Conversion Funnel and User Retention
Used SQL to examine the e-commerce conversion funnel and D7, D14, D21 and D28 retention across ten Latin American countries, comparing markets and customer cohorts.
Business questions
- At which stage does the largest conversion drop occur?
- Which countries have the strongest and weakest add-to-cart performance?
- How does retention change between D7, D14, D21 and D28?
- Which countries and cohorts show comparatively stronger long-term retention?
- What actions could improve conversion and user engagement?
Overall conversion funnel

| Funnel stage | Conversion rate |
|---|---|
| Select item | 76.90% |
| Add to cart | 11.01% |
| Begin checkout | 4.00% |
| Add shipping information | 2.42% |
| Add payment information | 2.09% |
| Purchase | 1.25% |
The largest drop occurred between product selection and cart addition: 65.89 percentage points. This is the clearest point in the observed journey to investigate before users formally begin checkout.
Country-level funnel comparison
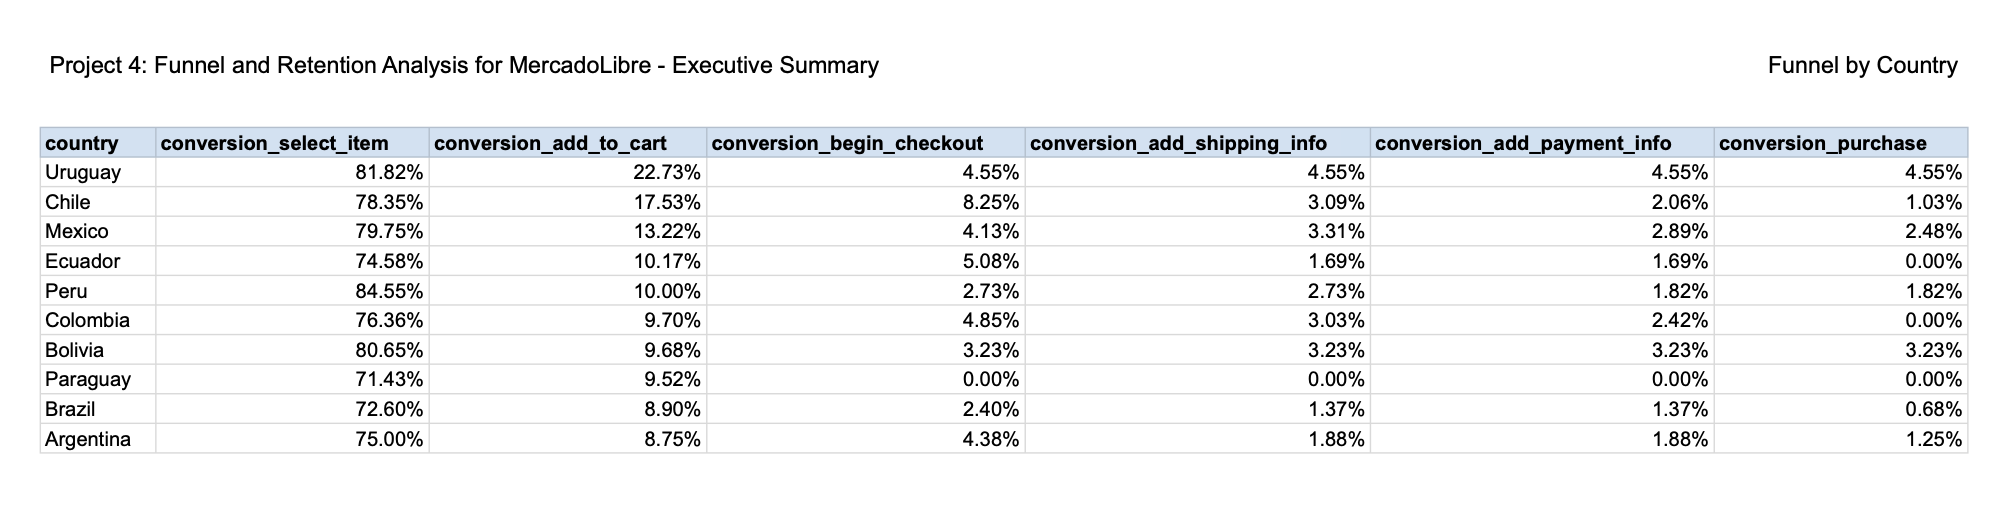
| Country | Add-to-cart rate |
|---|---|
| Uruguay | 22.73% |
| Chile | 17.53% |
| Brazil | 8.90% |
| Argentina | 8.75% |
Uruguay and Chile recorded the strongest add-to-cart results, while Brazil and Argentina showed the weakest among the countries highlighted.
Cohort retention
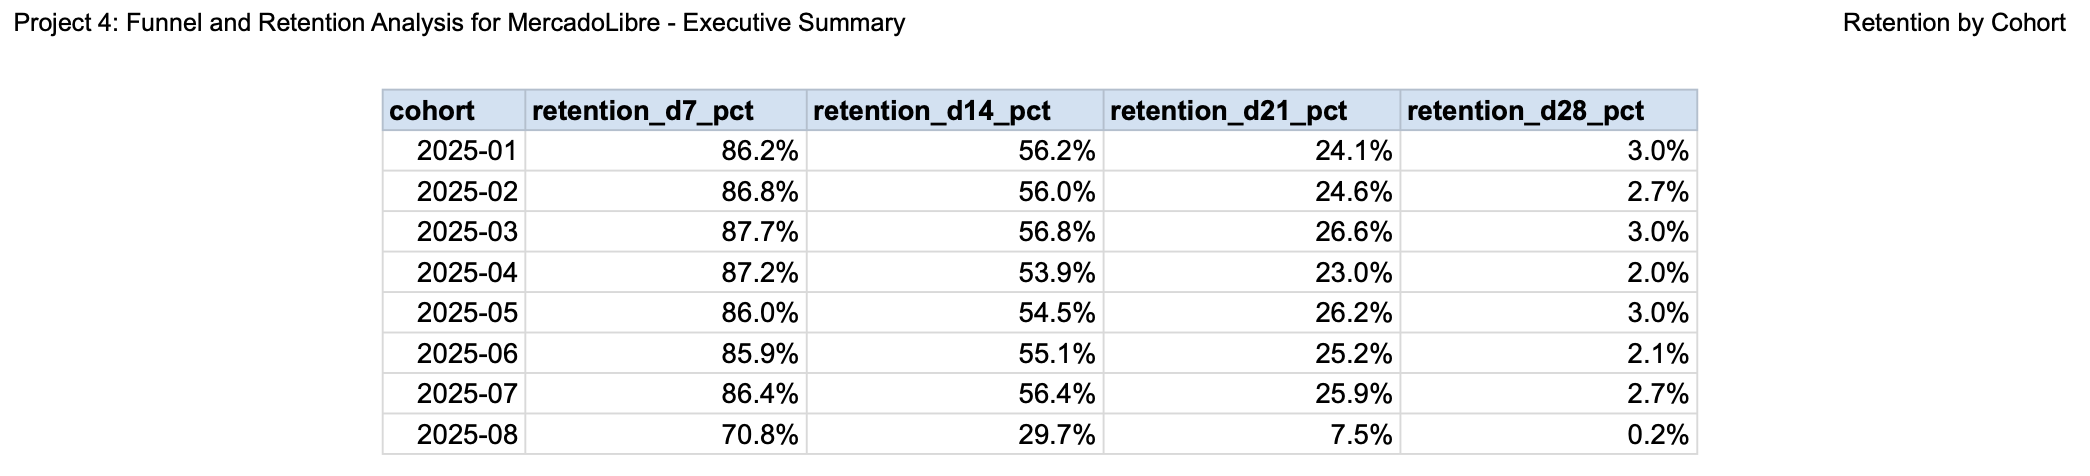
| Retention period | January 1–6 cohort |
|---|---|
| D7 | 86.2% |
| D14 | 56.2% |
| D21 | 24.1% |
| D28 | 3.0% |
At D28, Peru (3.2%) and Mexico (3.1%) showed the strongest results; Chile (1.7%) and Colombia (1.6%) were among the lowest.
Methodology
- Organized user events by funnel stage and calculated the percentage of users reaching each stage.
- Compared funnel performance across ten Latin American countries.
- Grouped users into cohorts according to their first activity date.
- Measured retention at D7, D14, D21 and D28.
- Validated results and interpreted the main business opportunities.
Business recommendations
- Investigate the transition from product selection to cart addition, including calls to action, product information, pricing, availability and possible usability barriers.
- Prioritize early-retention actions between D7 and D14, such as relevant reminders, personalized follow-up and re-engagement experiments.
- Compare stronger country results with lower-performing markets to identify practices worth testing, without assuming that market differences have a single cause.
Tools and methods
SQL · Common Table Expressions (CTEs) · Funnel Analysis · Cohort Analysis · Retention Analysis · Data Validation · KPI Interpretation · Executive Reporting.
The original SQL queries were executed in TripleTen's learning environment and are not currently available outside that platform. The repository documents the business problem, methodology, results and recommendations; it does not reproduce the original SQL scripts. The analysis is descriptive and does not establish causality. The available data does not include qualitative evidence explaining why users abandoned the funnel.