RappiPlus — Business Performance Analysis
Data Quality, Profitability, Funnel, Retention and Checkout Testing
Combined data-quality review, product-level profitability, conversion-funnel and cohort-retention analysis, and checkout A/B test evaluation using Python, SQL, statistical testing and Tableau.
Business questions
- Can the available order and event data be trusted?
- What do revenue and available product costs show about product-level profit?
- Which products and categories contribute to performance?
- Where do users drop off in the conversion funnel, and how does retention evolve?
- Did the checkout interface experiment improve conversion?
Adjusted operating view
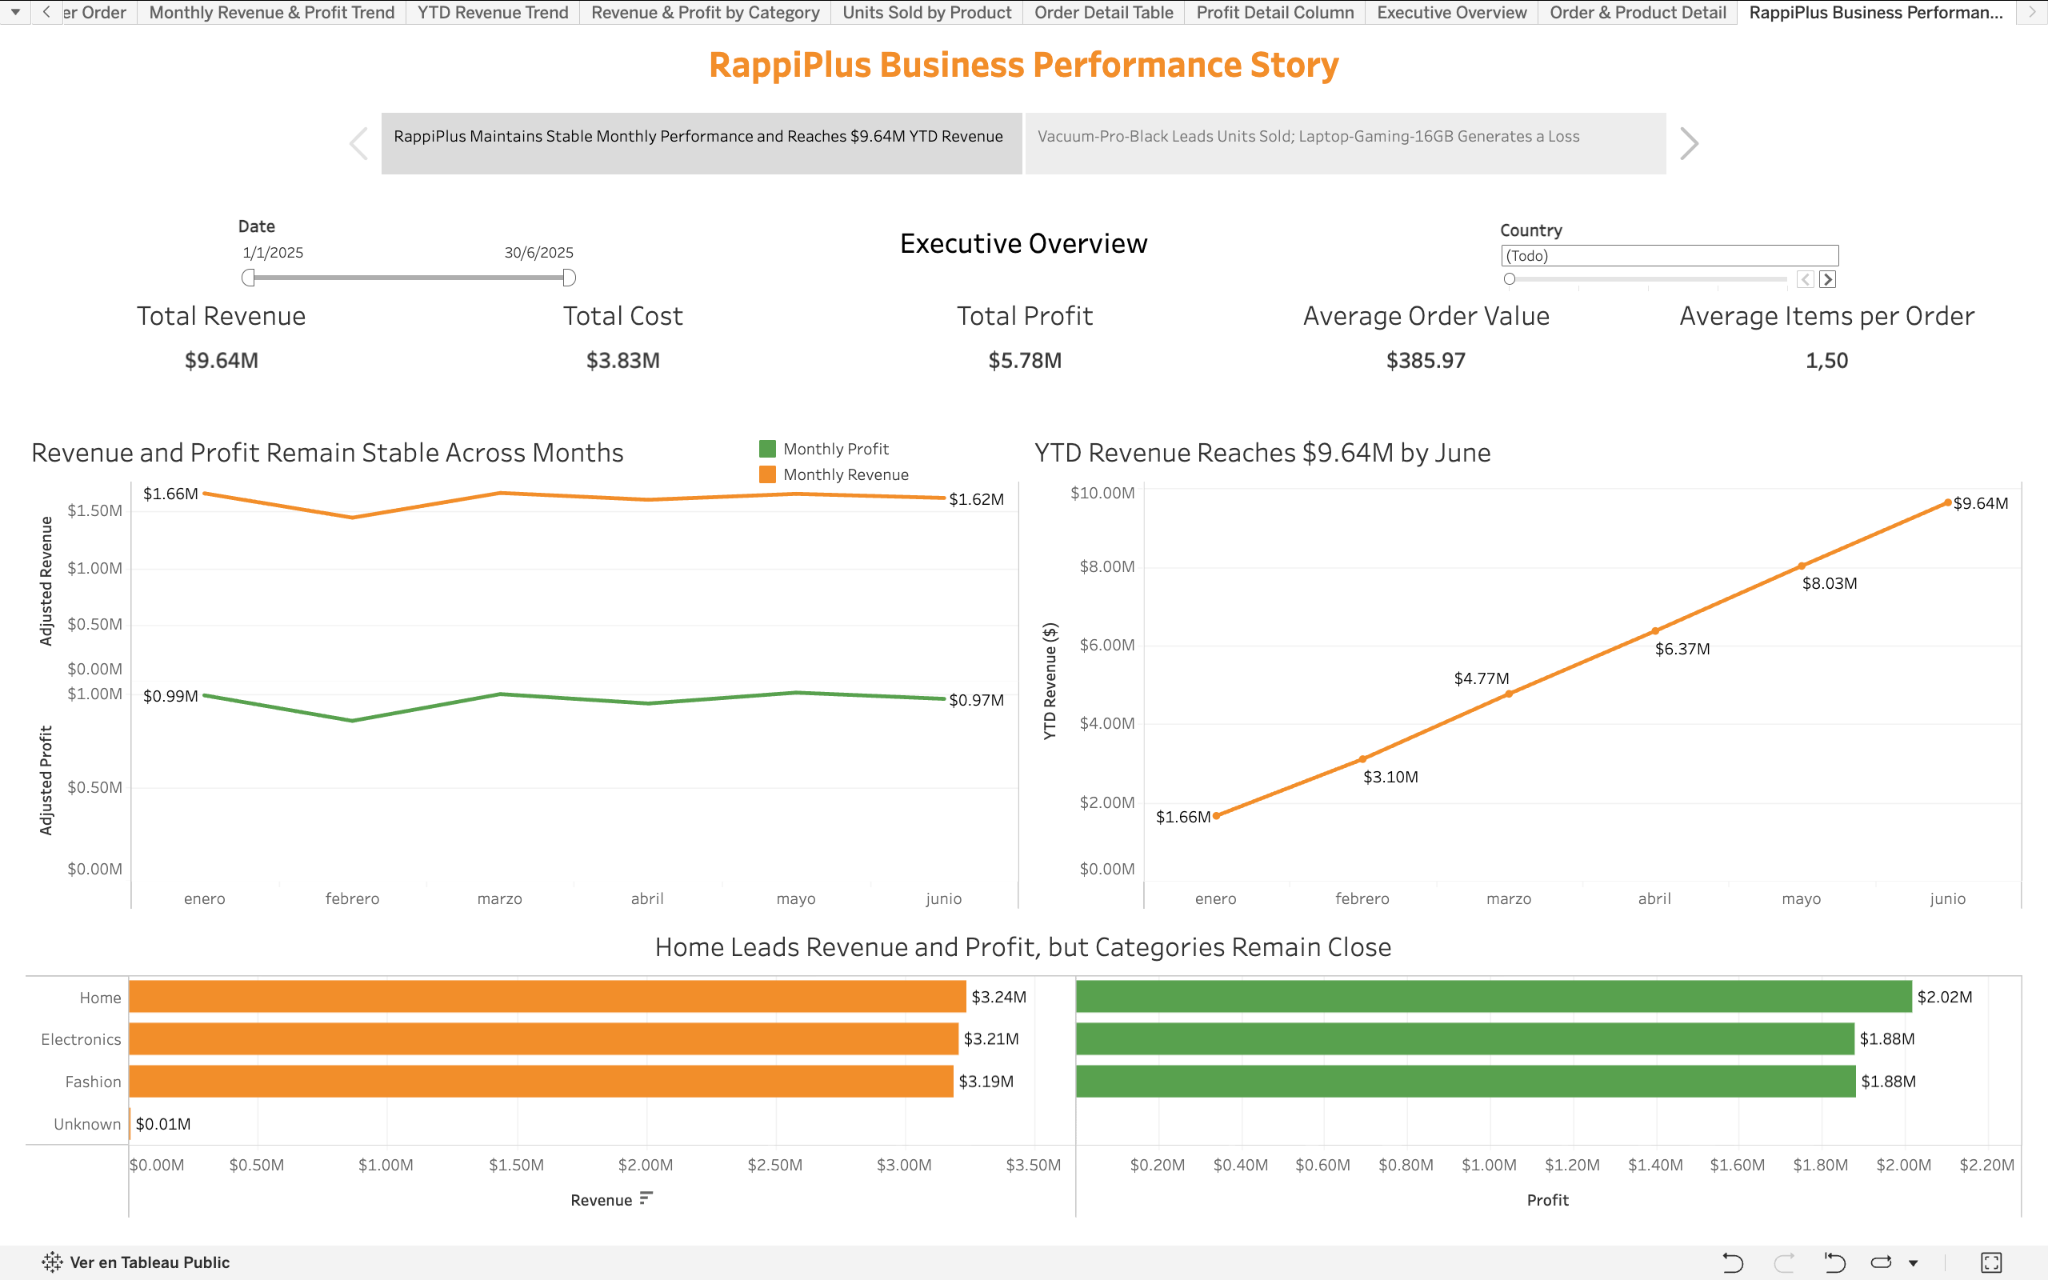
The raw dataset reported $51.99M in revenue. A small number of extreme-quantity records had a disproportionate effect, accounting for 81.45% of reported revenue and 91.12% of known product cost. The dashboard therefore presents an adjusted view that excludes extreme and invalid quantities to better represent typical operating performance.
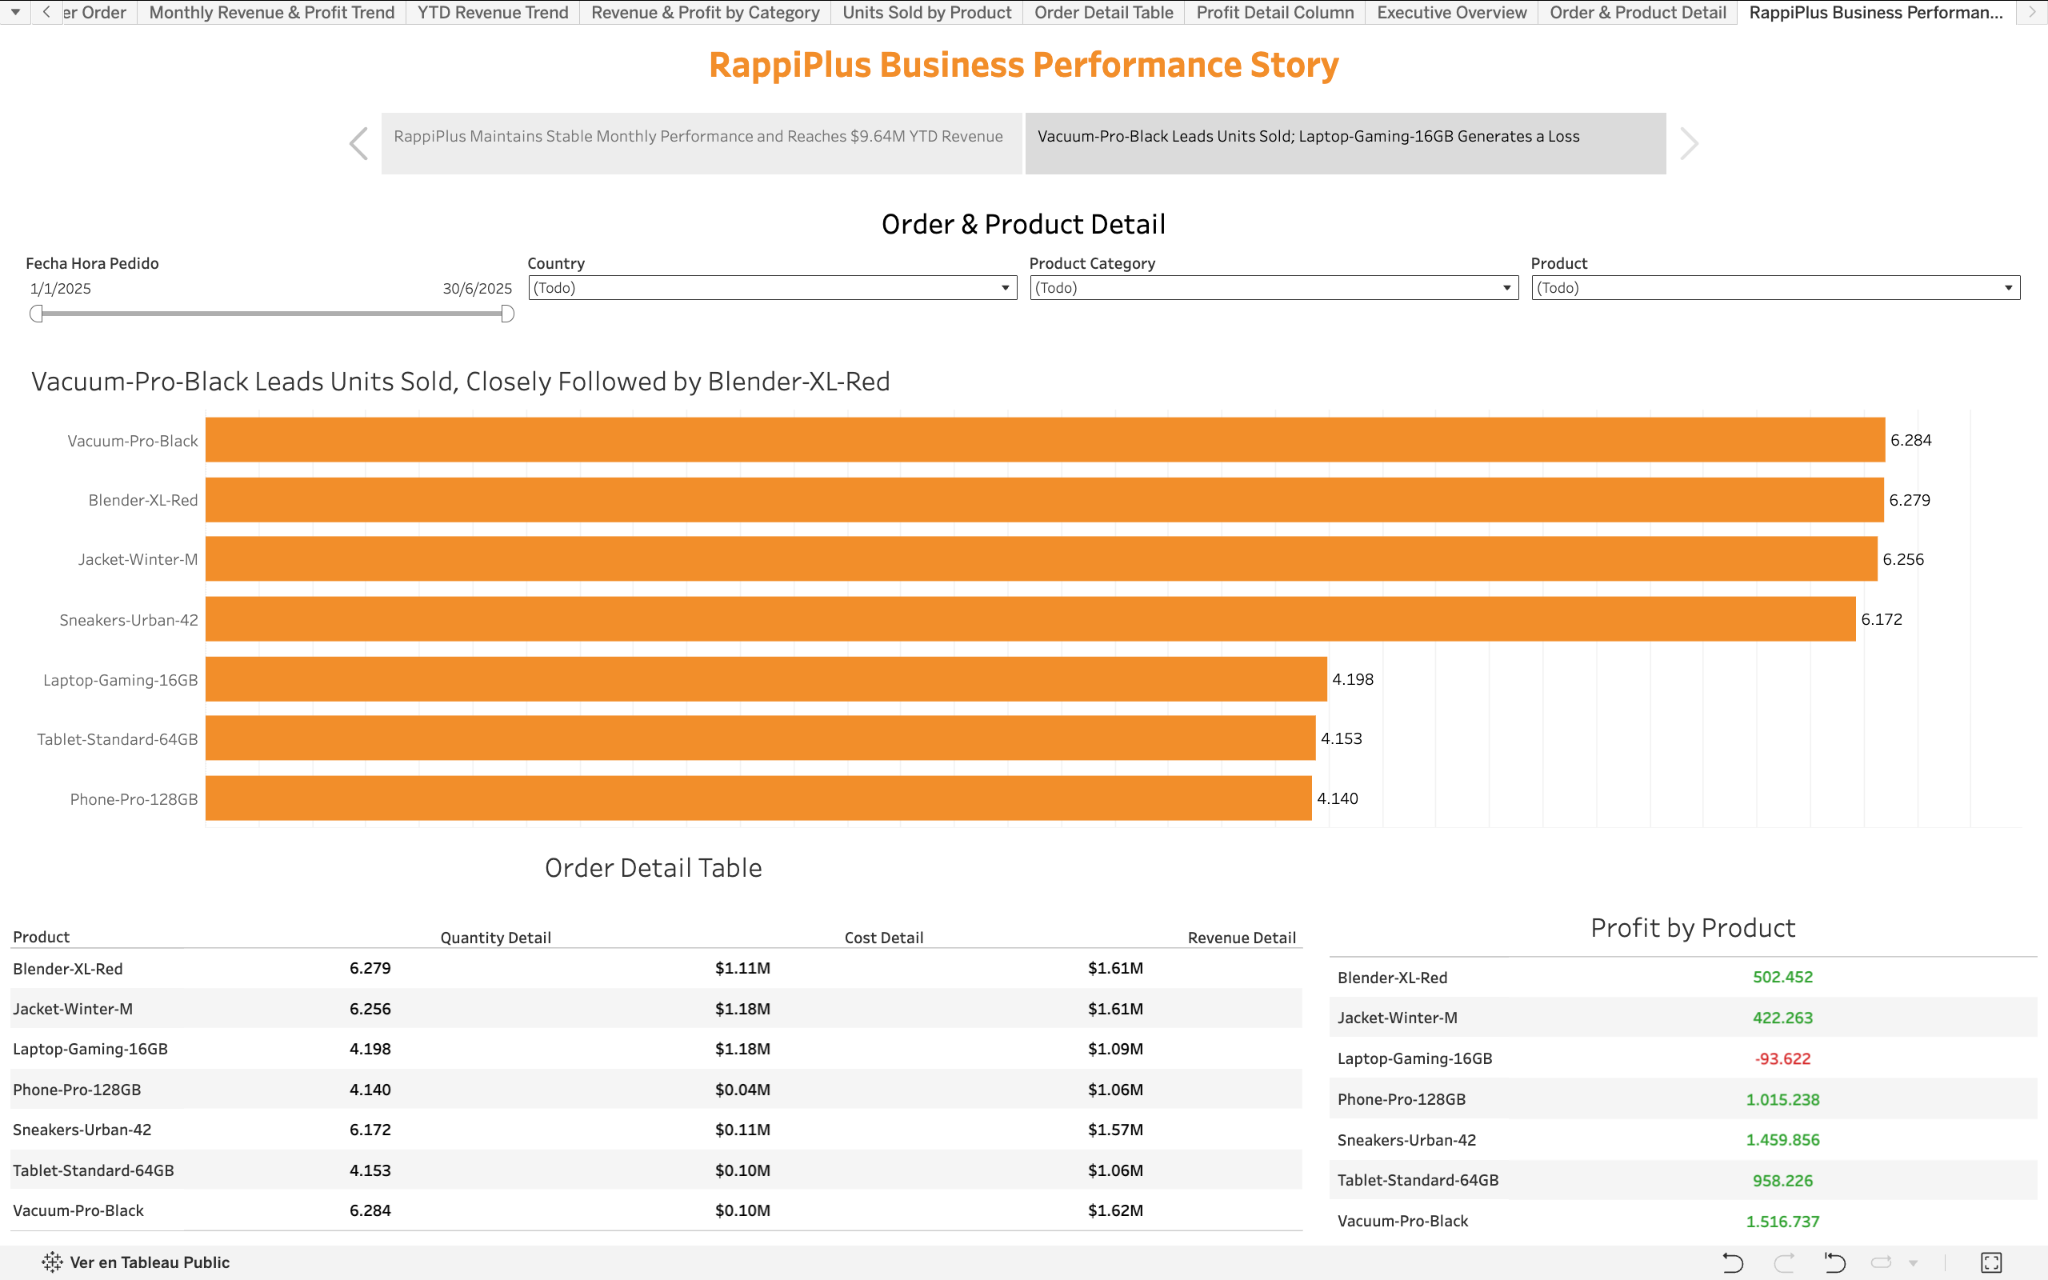
The top-selling product by units was Vacuum-Pro-Black. Product-level profit is before marketing and other operating expenses and only includes orders with known product costs.
Customer behavior and checkout experiment
| Area | Result | Business interpretation |
|---|---|---|
| Conversion funnel | Largest relative drop: begin_checkout → add_payment_info; stage conversion 86.71%. | The checkout-to-payment-information step is the clearest point for further review. |
| Retention | Week-3 retention was approximately 40%–44%; February cohort was highest at 43.98%. | February provides a useful comparison point, without establishing why its result was higher. |
| Checkout A/B test | Control 15.69%; treatment 16.29%; p-value 0.4161. | No statistically significant evidence that the tested checkout UI change improved conversion. |
Data quality and preparation
- Loaded and prepared order-level data, converted date fields and checked missing values and duplicates.
- Flagged invalid and unusually large quantities and compared raw with adjusted sales results.
- Joined product costs to assess product-level profitability.
- Retained 300 orders (1.20%) with unknown country because the records contained valid sales information and there was insufficient evidence to assign another location.
- Kept marketing spend separate from product-level profit because the data sources had different levels of granularity.
Dashboard deliverables
Business recommendations
- Review the unusual high-quantity orders before using raw revenue totals for planning; keep raw and adjusted views distinct.
- Investigate the checkout-to-payment-information step after validating event tracking.
- Keep the existing checkout version as the reference; gather more evidence before recommending the redesign on conversion grounds.
- Review sales and product profit together rather than prioritizing products by unit sales alone.
- Use cohort differences as a basis for further retention investigation, not as evidence of causal drivers.
Tools and analytical methods
Python: pandas, data cleaning, validation and exploratory analysis. SQL: funnel analysis, cohort retention and conditional aggregation. Statistics: two-proportion z-test and hypothesis testing. Tableau: KPI dashboards, filters, interactive views and business storytelling.
The SQL queries are included in the public notebook, but execution requires access to the original TripleTen training tables and a PostgreSQL connection. Credentials and the original course database are not included. The checkout experiment is not statistically significant; recommendations are proposed actions, and their business impact was not measured. Funnel event counts do not prove that every user followed a strictly sequential path.